

Levered vs. Unlevered IRR: What Real Estate Investors Need to Know
Understanding IRR in Real Estate
Internal Rate of Return (IRR) is a core metric for evaluating the profitability of income property investments. It is perhaps the one metric that accounts for the interplay between the magnitude and the timing of future cash flows.
From my experience, investors agree that a high rate of return is better than a low rate, but some are less clear about exactly what IRR is and how it’s calculated. So let’s start with some basics—and then dig deeper into levered and unlevered IRR.
Discounted Cash Flow is at the heart of IRR. We know that the longer we must wait to receive cash in the future, the less it is worth today. So we discount all the future cash flows we expect to receive from an income property to the present and add those present values up. Hence, we have the present value of the future income stream.
The secret sauce here is the discount rate. What discount rate makes the present value of the future cash flows equal to what we paid for them? That discount rate is the Internal Rate of Return. To put it another way, it’s the rate that makes the discounted value of the property’s future income stream equal to our initial cash investment. Let’s look at some numbers:
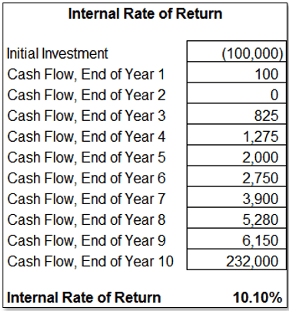
We invest $100,000 at the beginning of year 1 (it’s a negative amount because it’s cash flowing out). Then we get some periodic cash flows coming in for several years. Finally, we get big cash flow when we sell the property. The result is an IRR of 10.10%.
Timing matters. If we were to reverse the order of the year 1 through 9 cash flow, so the larger amount came sooner, the IRR would rise to 10.81%. A higher rate of return, even though the total number of dollars received is exactly the same, all because we didn’t have to wait as long to get some of those dollars.
What is Levered vs. Unlevered IRR?
Now let’s get to the topic I promised in the title of this article, which is the difference between levered and unlevered IRR. For clarity, let’s look at unlevered first.
Unlevered IRR
With unlevered IRR, we have no debt financing. This is an all-cash purchase, so initial investment is the purchase price of the property. The annual cash flows are effectively the annual Net Operating Income, i.e., the revenue minus the operating costs. There is no mortgage payment to account for. The reversion (sale of the property at the end of the holding period) is the selling price of the property, net of any direct costs of sale. There are no mortgages to pay off.
Levered IRR
With levered IRR, we calculate our return on an investment where we have debt financing. That means our cash investment is not the total cost of the property but rather the amount of cash we actually bring to the deal, our equity. Our levered IRR is our return on our equity investment.
What about our cash flows? With levered IRR, we’re measuring the cash flows after debt service. And our final cash flow when we sell the property is the amount we receive after paying off any mortgage balance.
An Example
5-Year Hold – Multifamily
- Purchase Price: $1,000,00
- Holding Period: 5 years
- Annual NOI (Years 1–5): $68,000, increase 2% per year
- Sale Price (Year 5): $1,200,000
- Selling Costs: 6% of sale price
Scenario 1: Unlevered IRR (All Cash)
Cash Flows:
- Initial Investment: -$1,000,000
- NOI (Years 1–5): $68,000, $69,360, $70,747, $72,162, $73,605
- Sales Proceeds (Year 5): $1,200,000 – 6% = $1,128,000
- Total Year 5 Cash Flow = NOI + Sale Proceeds: $73,605 + $1,128,000 = $1,201,605
Unlevered IRR = 9.18%
Scenario 2: Levered IRR (70% Loan)
Loan:
- Amount: $700,000 (70% LTV)
- Annual Debt Service: $42,000
- EOY 5 Balance: $632,024
Equity Investment:
$1,000,000 purchase price – $700,000 loan = $300,000
Cash Flow After Debt Service (Years 1–5):
- Year 1: $68,000 – $42,000 = $26,000
- Year 2: $69,360 – $42,000 = $27,360
- Year 3: $70,747 – $42,000 = $28,747
- Year 4: $72,162 – $42,000 = $30,162
- Year 5: $73,605 – $42,000 = $30,765
Sale Proceeds After Debt Payoff: $1,128,000– $632,024 = $495,976
Total Year 5 Cash Flow: $30,765 (NOI after debt) + $495,976 (sale proceeds) = $526,741
Levered IRR = 18.45%
vs Unlevered: 9.18%
What are the Benefits of Each Approach?
Unlevered IRR
- The key benefit of this approach is that it focuses strictly on the performance of the property itself, and so it’s well suited for comparing properties and even comparing to a real property to other types of investment opportunities.
- Since it measures performance without the impact of financing, the results can’t be skewed by the financing terms available to a particular buyer or within a particular market.
- Appraisers and institutional investors generally prefer to look at the unlevered IRR, again because it’s not affected by anything external to the property itself.
Levered IRR
- Levered IRR is more in tune with how most investors operate because it measures the return on their actual cash investment, their equity.
- It helps evaluate whether the risk of using debt justifies any increased return.
- It helps you to model different financing structures.
Bottom Line
Understanding both levered and unlevered IRR is essential for any investor evaluating real estate opportunities. While unlevered IRR reveals the property’s core operating performance without the influence of debt, levered IRR reflects the actual returns an investor might realize after accounting for financing—along with the added risks that leverage brings. Remember, higher potential returns often come hand-in-hand with increased exposure to risk, such as rising borrowing costs or challenges in meeting debt obligations. Always approach your underwriting with diligence and a clear-eyed view of both the rewards and risks before committing to any investment decision.
The best way to underwrite investment property? Use RealData’s Real Estate Investment Analysis software, and let us do the math, so you can do the deal.
Here’s a fun fact postscript: Back in the early 1980’s, when our investment model was based on Microsoft’s spreadsheet du jour called Multiplan, they didn’t have an IRR function. I showed them how to compute it in a regular spreadsheet using an iterative approach called “successive approximations,” which they then programmed as a function for users. Later, RealData became one of their first beta-test sites for a new product called Excel.